

Dashboard
Copied! Paste it into your favorite AI (Ctrl/Cmd+V)
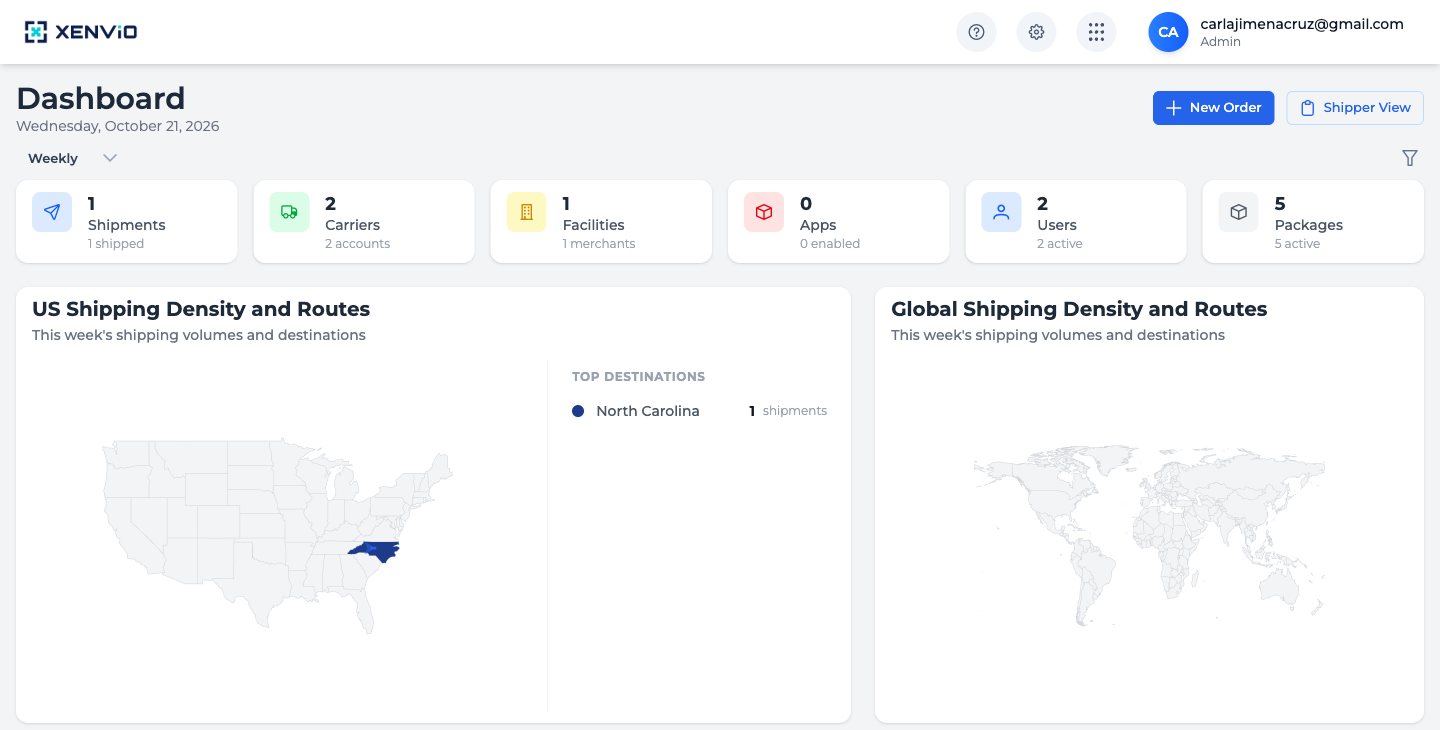
The Dashboard provides a real-time overview of your shipping operations, including key metrics, trend charts and a geographic distribution map.
1
Main Panel
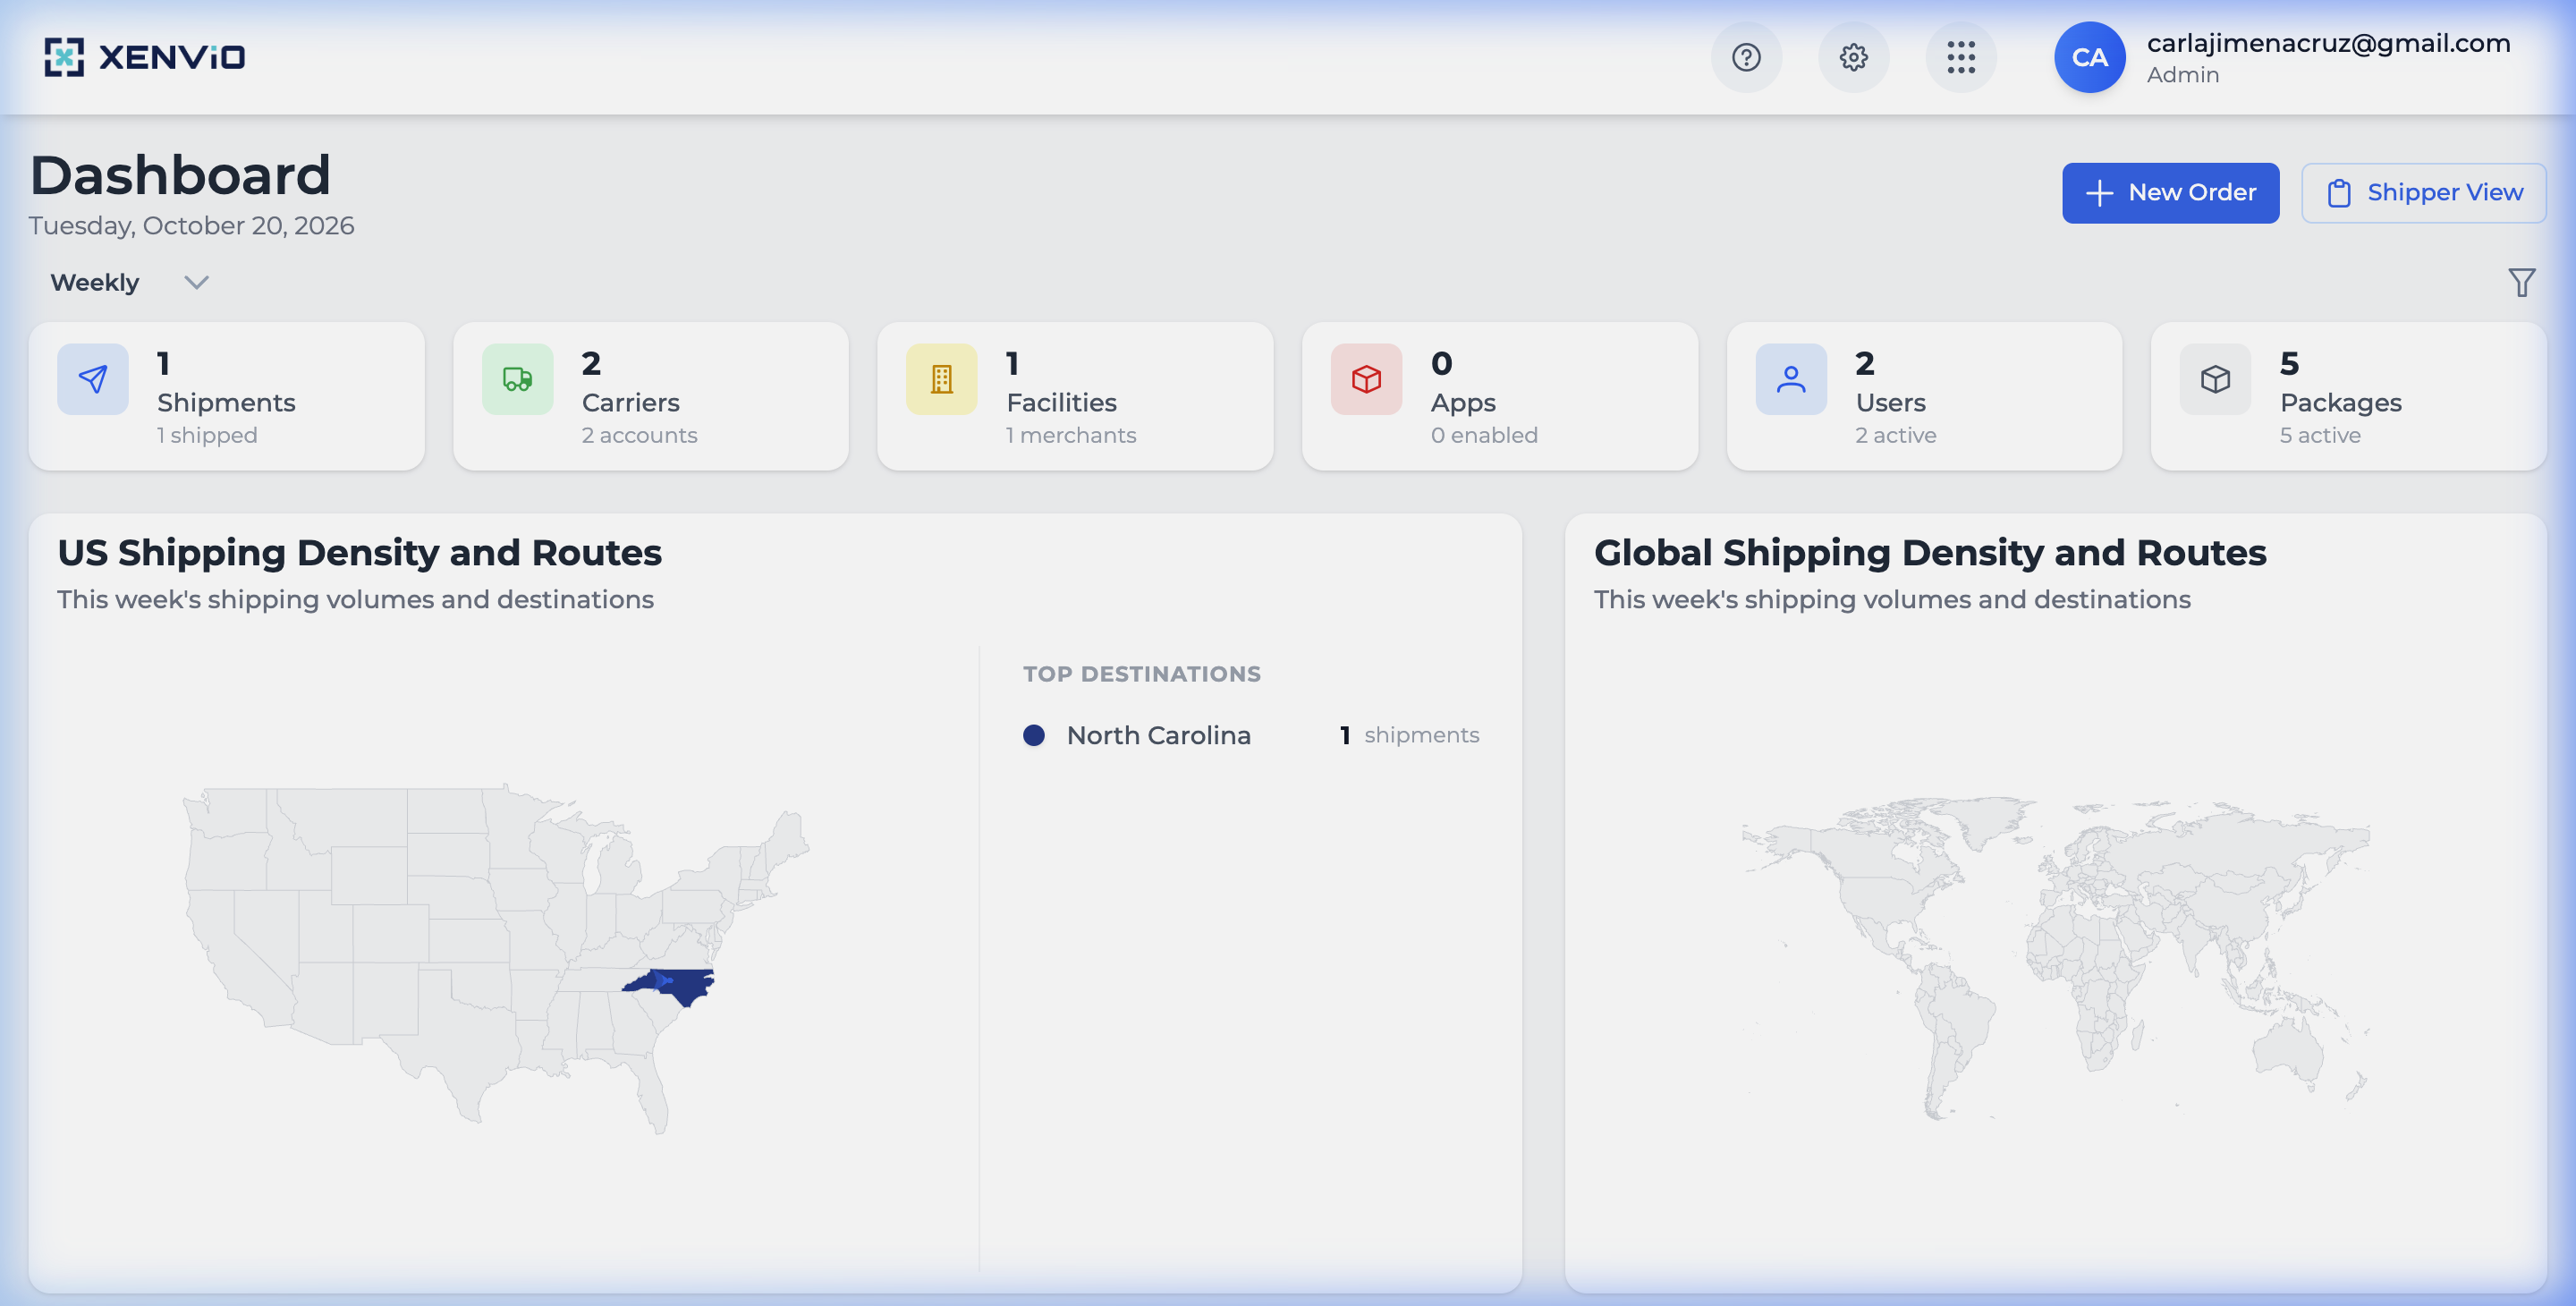
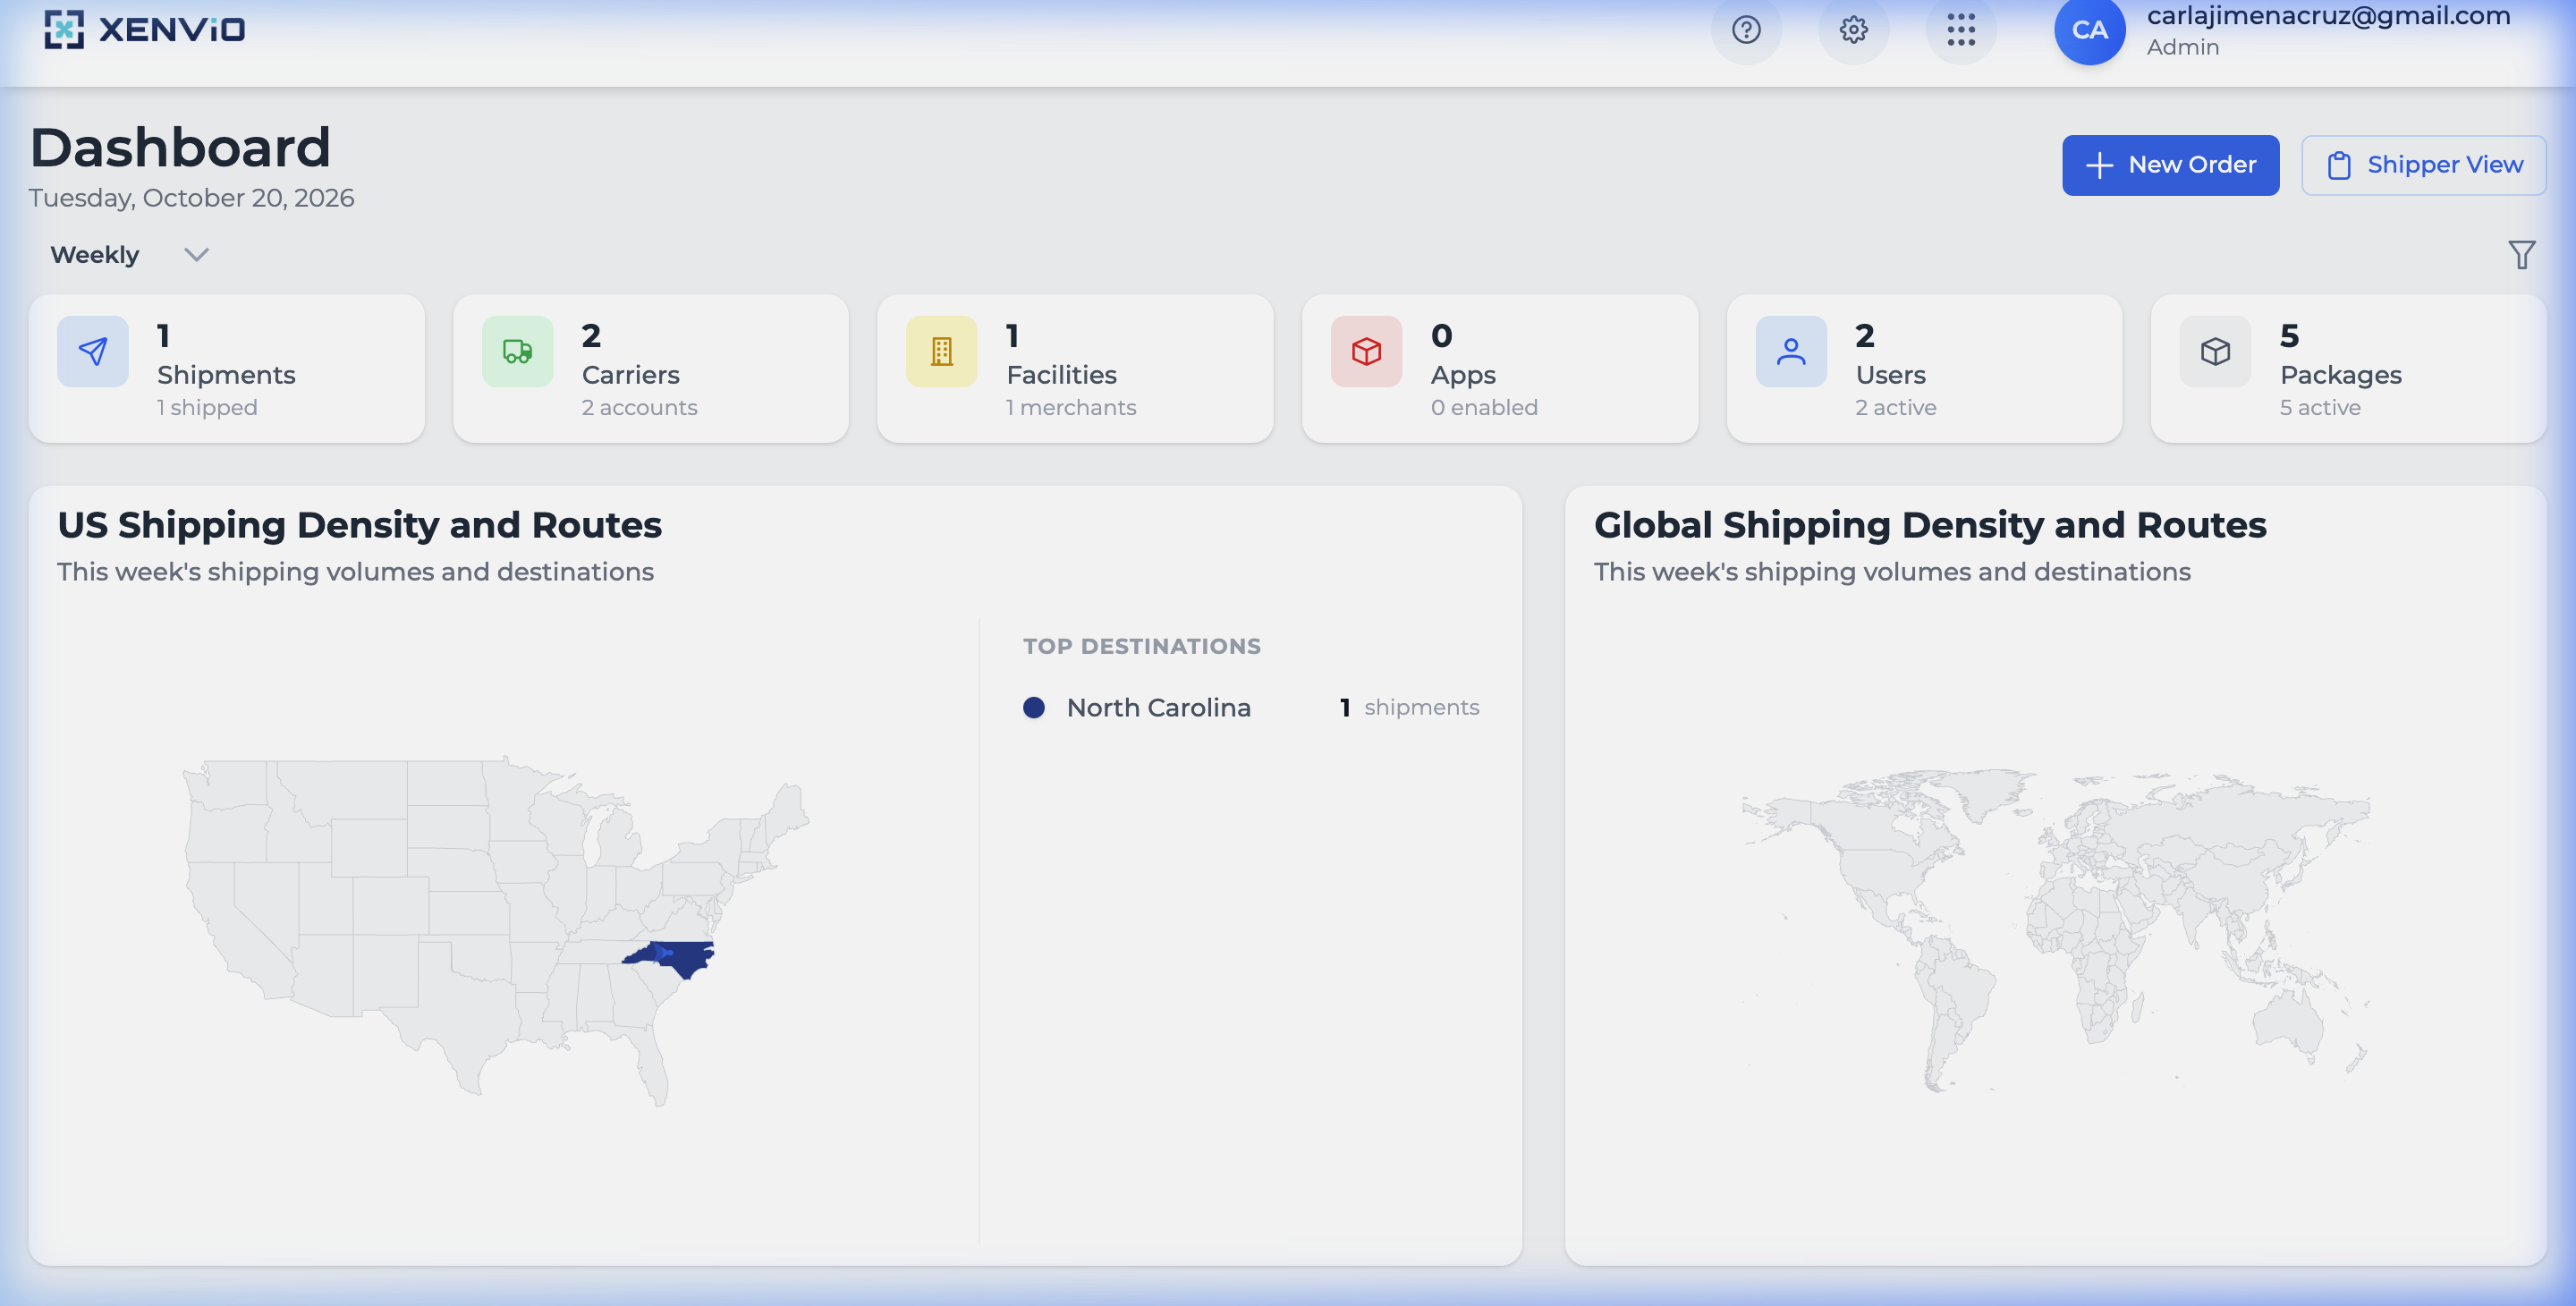
Metric cards at the top: Shipments (with shipped status), Carriers (accounts), Facilities, Apps, Users and active Packages. Filter by period using the Weekly/Monthly selector.
2
Distribution Maps
US Shipping Density and Routes shows the most frequent destinations in the US. Global Shipping Density shows international distribution. Both include a Top Destinations ranking with shipment volume.
Demo completed!
1 of 2
Features
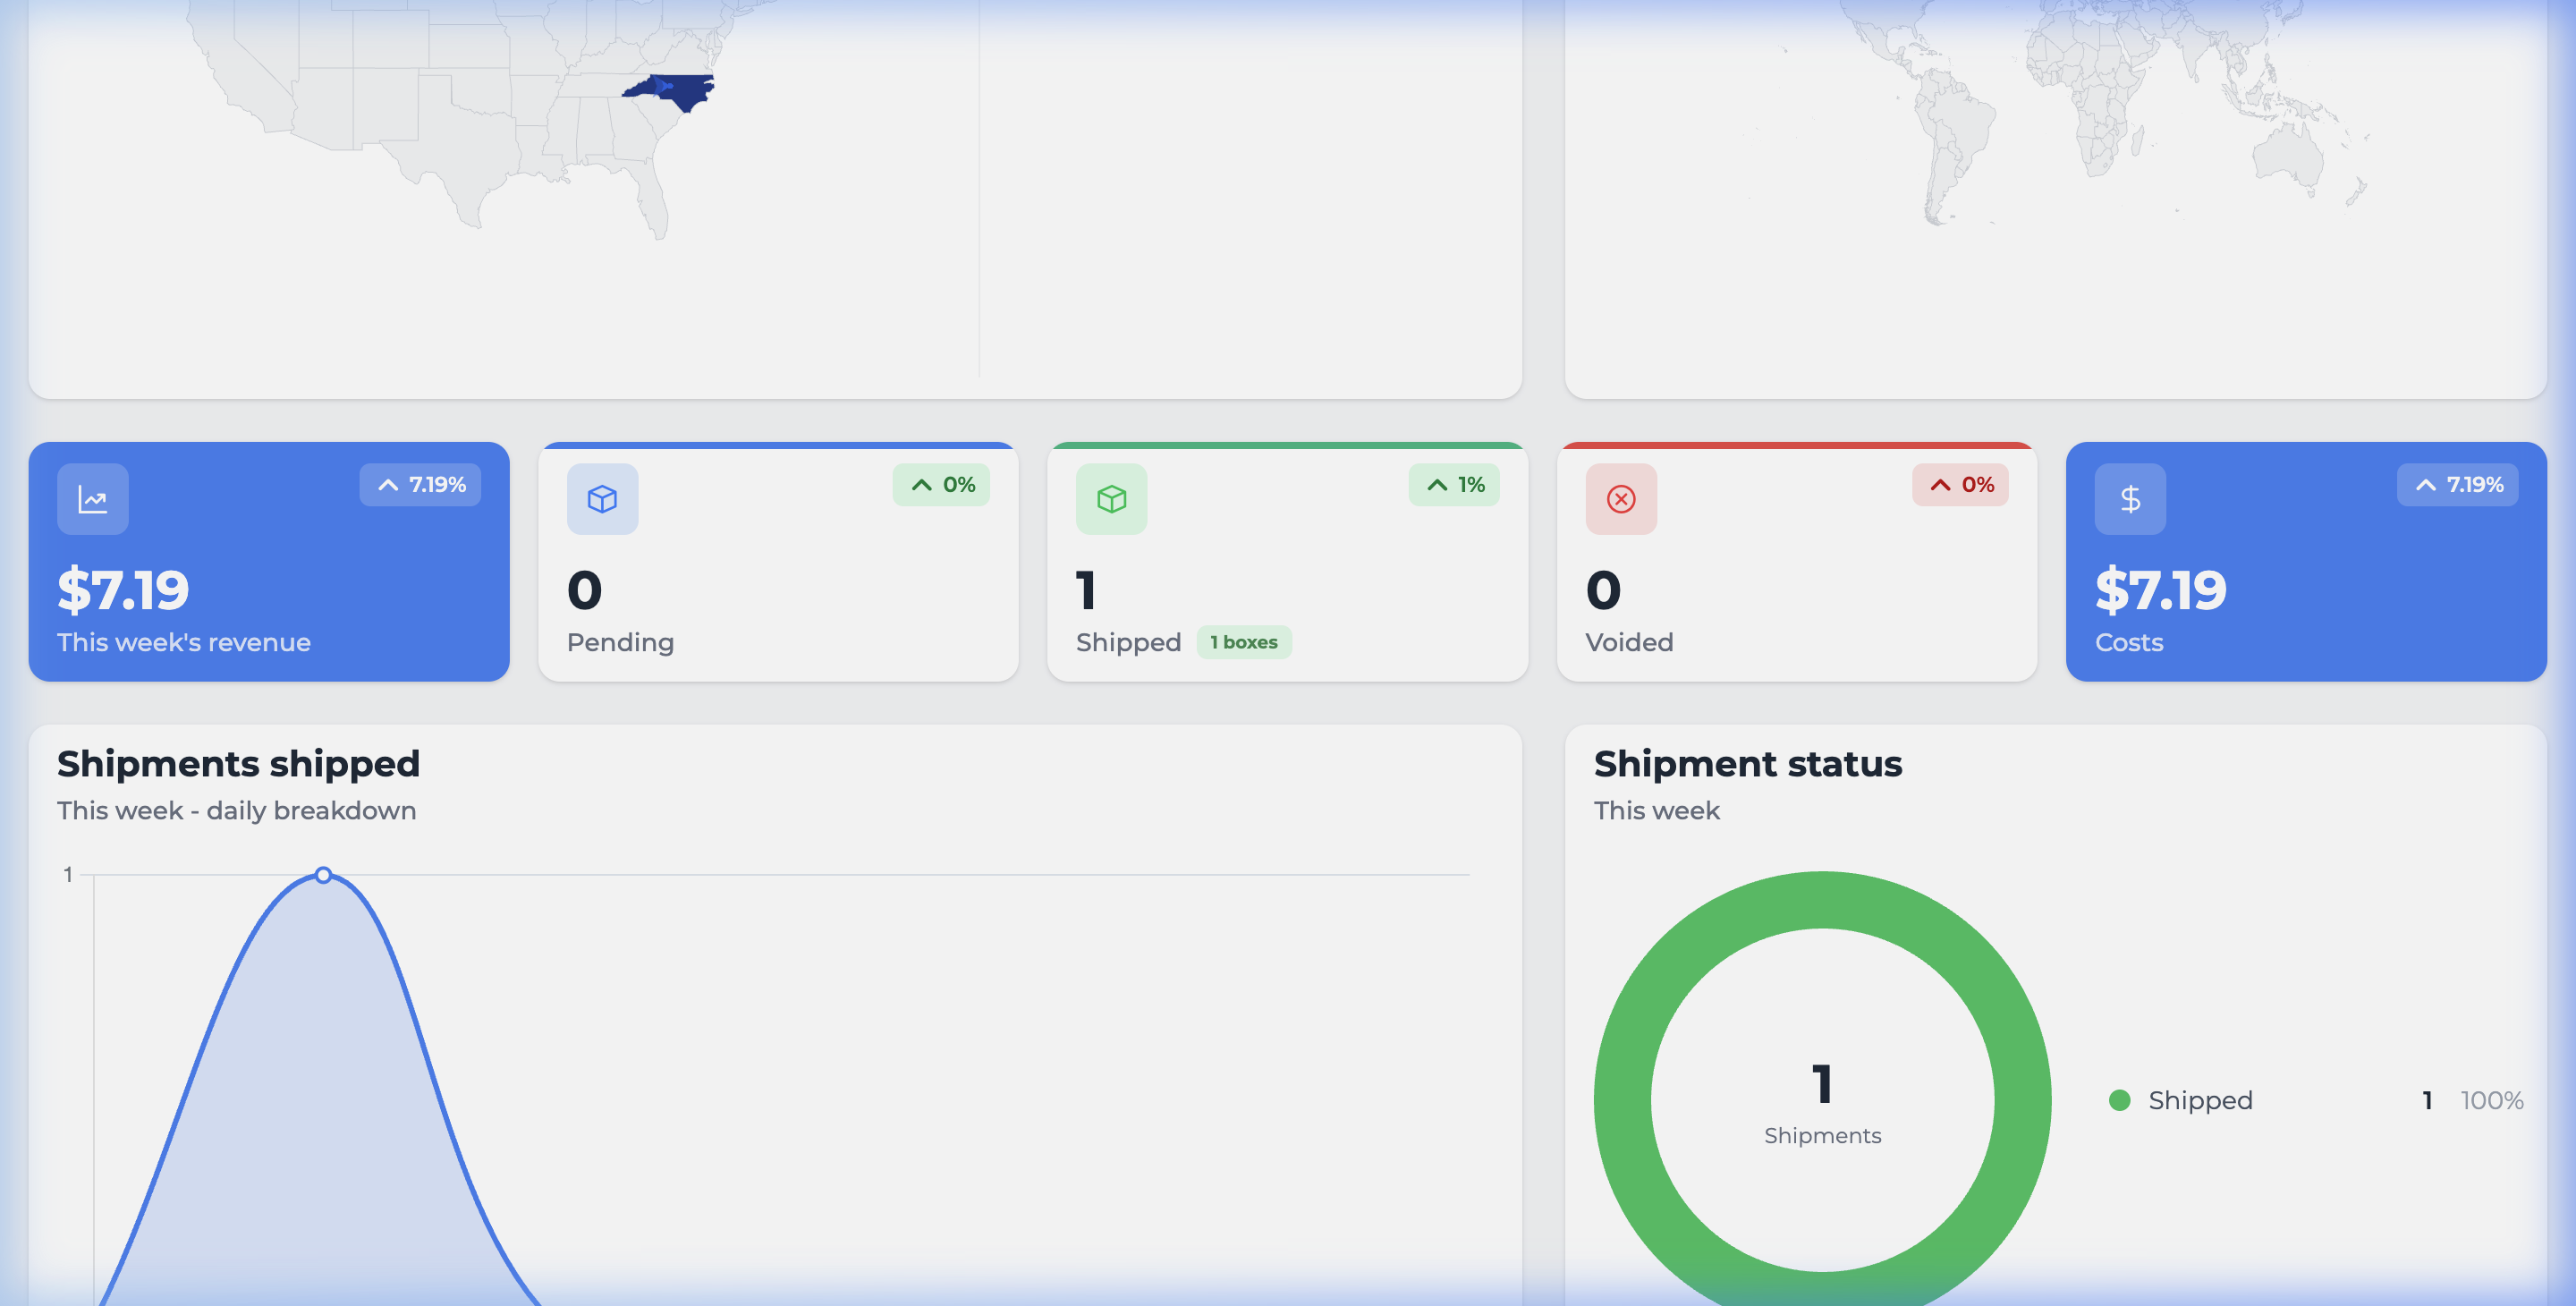
Section titled “Features”- Metric Cards: Total shipments, spending, active and completed orders
- Trend Chart: Temporal shipment visualization by period
- Distribution Map: Interactive USA/World map with delivery points
- Advanced Filters: Period, Facility, App or Store
Shipper View Manage your shipments from the main module.